Farmers grow crops wherever the climate, soil, water, and human infrastructure line up well enough to make production viable. In practice, that means the world's food comes from a surprisingly concentrated set of places: the temperate grain belts of the U.S. Midwest, Canadian Prairies, and Northern China; the tropical lowlands of Southeast Asia and Sub-Saharan Africa; the irrigated valleys of California, India's Punjab, and Egypt's Nile Delta; and the humid subtropical zones of Brazil and Argentina. In the United States specifically, corn and soybeans dominate the Corn Belt (Iowa, Illinois, Indiana), wheat rules the Great Plains (Kansas, Oklahoma, North Dakota), cotton anchors the Southeast and Texas, and fruits and vegetables concentrate in California and Florida. Where a farmer chooses to grow a particular crop always comes back to a handful of physical realities, temperature range, frost-free days, annual rainfall, soil depth and pH, layered on top of practical human decisions about markets, labor costs, and policy.
Where Do Farmers Grow Crops: Global, U.S. & Historical Map

How to use this guide
This guide is organized from big picture to specific action. It starts with the universal factors that shape crop geography everywhere on earth, then moves into ranked regional examples (global first, then U.S. states), and closes with a practical checklist you can use for your own site. The tables in this article each compare multiple attributes across crops or regions, think of them as quick reference grids. If you want to understand why a particular region grows what it grows, the physical and human factors sections are the right starting point. If you are trying to decide what to grow on a specific piece of land, skip to the decision guide at the end. Students looking for a simplified overview will find a child-friendly summary there as well. Throughout the article you will find references to related topics on this site, including rankings of the best places in the world for crops, best U. For a simple class-level explanation, see where do farmers grow crops class 1. See our related article Where do crops grow best for detailed regional rankings and maps. For a concise overview, see the site guide "Where do crops grow?" which summarizes the main physical and human factors that determine crop locations. S. states by crop group, and the soil pH ranges most crops prefer, all of which extend what this guide covers.
Physical factors that determine where crops grow
Climate and temperature
Temperature is the first filter. Every crop has a minimum, optimum, and maximum temperature range within which it can germinate, grow, and set seed. FAO's EcoCrop database catalogs these ranges for hundreds of crops, and they explain most of the global crop map at a glance. Corn needs average growing-season temperatures above roughly 50°F (10°C) and at least 120 frost-free days. Wheat tolerates colder winters and does well with cool spring temperatures between 55–65°F. Tropical crops like sugarcane, bananas, and cassava require year-round warmth well above freezing. The USDA Plant Hardiness Zone map and NOAA's 1991–2020 Climate Normals are the standard references U.S. farmers use to match crops to their location.
Rainfall and seasonal water supply
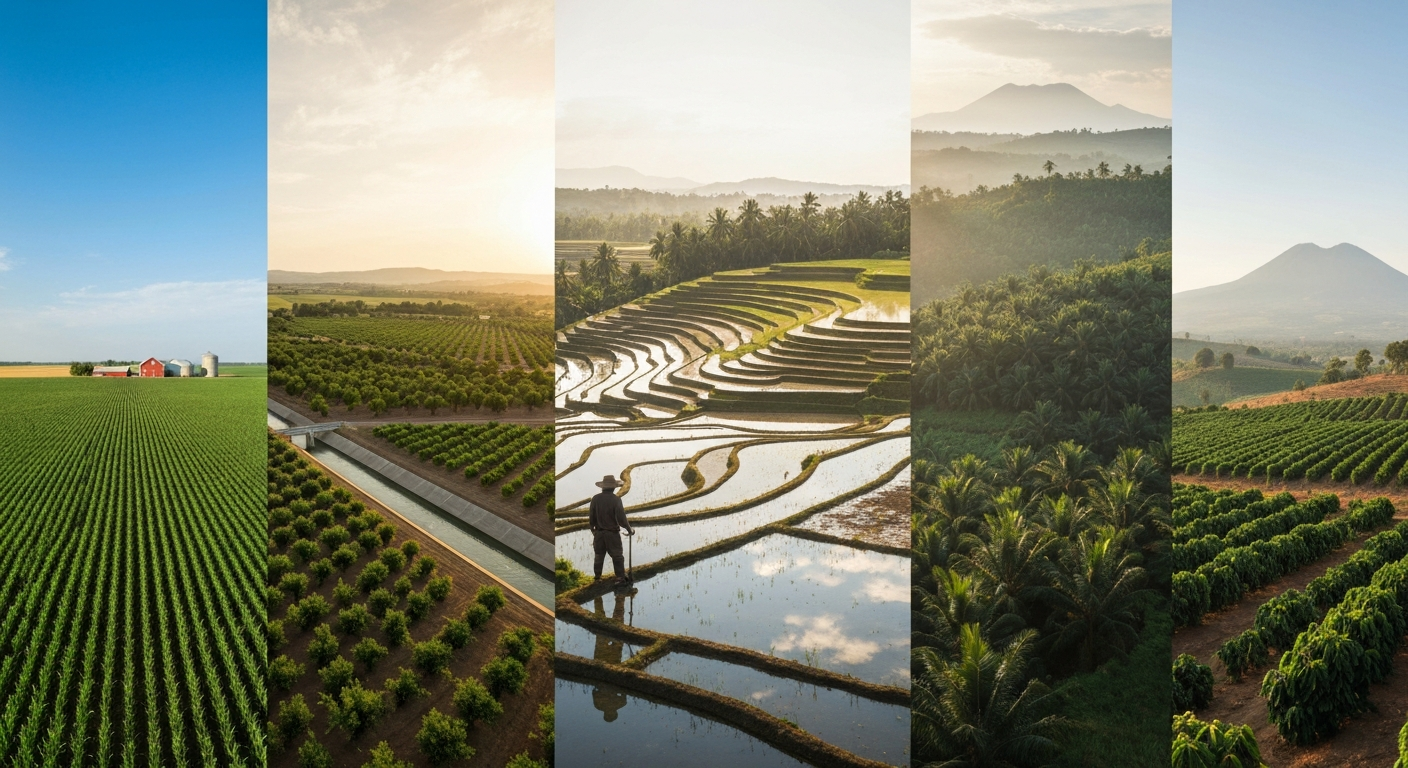
Annual rainfall totals matter, but timing matters even more. Cotton needs dry conditions at harvest even though it requires adequate moisture during flowering. Rice needs standing water or near-constant soil saturation through much of its growth cycle. The global MIRCA-OS dataset separates irrigated from rainfed cropped areas globally, and the split is striking: roughly 40 percent of global crop calories come from irrigated land that makes up only about 20 percent of total harvested area. That tells you irrigation is not a luxury add-on, it is the reason high-value crops grow in California's Central Valley, India's Punjab, and Egypt at all. Where rainfall is reliable and well-distributed across the growing season (much of the U.S. Midwest, Western Europe, parts of East Africa's highlands), farmers can rely on rainfed production. Where rainfall is low or seasonal, irrigation infrastructure or drought-tolerant crop choices become essential.
Soils: depth, texture, and pH
Deep, well-drained loam soils with good organic matter are the gold standard for most field crops. The U.S. Corn Belt sits on some of the deepest mollisols (prairie soils) on earth, which is a major reason it produces so much corn and soy. Soil pH is especially important and often overlooked. Most crops perform best in a pH range of 6.0 to 7.0, where nutrient availability peaks. Blueberries are an exception, preferring pH 4.5–5.5. Alfalfa wants pH above 6.5. When pH drifts outside a crop's preferred range, nutrients become chemically unavailable even if they are physically present in the soil. USDA's Web Soil Survey (SSURGO) provides field-level U.S. soil data including pH, drainage class, and texture. For global context, ISRIC's SoilGrids offers gridded soil pH maps at 250 m resolution. Soil pH is covered in more detail in a companion article on this site.
Topography and slope
Flat to gently rolling land is strongly preferred for mechanized row-crop farming. Slopes above about 8 percent increase erosion risk and make large equipment difficult or dangerous to operate. The Shuttle Radar Topography Mission (SRTM) 30-meter DEM is the standard global elevation dataset used to derive slope maps for agricultural planning. Steep terrain is not necessarily unproductive, terraced hillsides in Peru, Vietnam, and the Philippines grow rice and vegetables at high elevations, but the labor and infrastructure investment required is substantial. In the U.S., the Corn Belt's glacially-flattened landscape was a major comparative advantage over, say, Appalachia or the Ozarks.
Water access and infrastructure
Access to water goes beyond rainfall. Proximity to rivers, aquifers, reservoirs, and irrigation canals determines whether a dry-climate region can support crops at all. California's Central Valley depends almost entirely on surface water imported via the State Water Project and federal Central Valley Project, plus groundwater from the San Joaquin Valley aquifer system. NASA's GRACE satellite gravity data has documented severe groundwater depletion in both California's Central Valley and the Southern High Plains (the Ogallala Aquifer), flagging them as long-term sustainability concerns. Farmers choosing new sites need to assess not just current water availability but aquifer recharge rates and water-rights law.
Human factors that shape crop geography
Physical suitability sets the ceiling, but human decisions determine what actually gets planted. Markets are the most immediate driver: a farmer in Iowa grows corn partly because the local infrastructure (grain elevators, ethanol plants, feed mills) makes it economically rational to do so. Proximity to processing and export facilities lowers transaction costs. Labor availability shapes high-labor crop choices, specialty fruit and vegetable production in California, Florida, and the Pacific Northwest is possible partly because of an established seasonal agricultural labor supply. Government policy adds another layer: crop insurance subsidies, commodity support programs, and export agreements all influence which crops pencil out financially. In developing countries, land tenure security is often the binding constraint, farmers with insecure tenure are less likely to invest in perennial crops or soil improvement. Technology and infrastructure matter too: precision irrigation, GPS-guided equipment, and access to certified seed expand what a farmer can realistically grow.
Best places in the world for major crop groups
The rankings below draw on FAOSTAT production data, FAO GAEZ v4 suitability assessments, and long-established production geography. They highlight regions that combine the strongest physical suitability with the scale of actual production. A companion article on this site explores the best places in the world for crops in greater depth.
| Crop Group | Top Global Regions | Key Reasons |
|---|---|---|
| Grains (wheat, corn, rice) | U.S. Midwest, Northern China, Indian subcontinent, Ukraine/Russia, Brazil Cerrado | Deep fertile soils, adequate growing-season rainfall or irrigation, flat terrain for mechanization, long frost-free seasons |
| Roots & Tubers (potato, cassava, yam) | Andes (Peru, Bolivia), Sub-Saharan Africa (Nigeria, DRC, Ghana), Northern Europe (Netherlands, Germany) | Cool moist climates for potato; warm humid tropics for cassava and yam; loose well-drained soils |
| Fruits (tropical & subtropical) | Brazil, India, China, Southeast Asia (bananas, mangoes, citrus), Mediterranean Basin (citrus, grapes, olives) | Year-round warmth or long frost-free seasons; specific humidity and rainfall patterns; alluvial or volcanic soils |
| Vegetables | China (world's largest producer), India, United States (California, Florida), Spain, Mexico | Reliable water supply, moderate temperatures, proximity to large urban markets, suitable loamy soils |
| Oilseeds (soy, palm, canola, sunflower) | Brazil & Argentina (soy), Southeast Asia (palm oil), Canada (canola), Ukraine & Russia (sunflower) | Climate-crop match; flat arable land; export infrastructure; Brazil soy expanded into Cerrado savanna soils |
| Fiber (cotton, jute) | United States (Texas, Southeast), India, China, Central Asia (Uzbekistan) | Long frost-free season (210+ days for cotton), low humidity at harvest, irrigation availability |
| Specialty Crops (coffee, cacao, tea, spices) | Ethiopia, Colombia, Brazil (coffee); Côte d'Ivoire, Ghana (cacao); China, India, Kenya (tea) | Specific altitude and temperature ranges, distinct wet/dry seasons, volcanic or well-drained highland soils |
A few patterns stand out. The world's grain production is remarkably concentrated in just a few continental interiors where glacial or alluvial soils are deep and relatively flat. Tropical specialty crops cluster in highland zones (coffee typically 1,800–2,400 m elevation) or humid lowlands (cacao below 600 m), not because the tropics are uniformly suitable but because altitude moderates temperatures in precisely the range these crops need. Palm oil's dominance in Malaysia and Indonesia traces directly to year-round high rainfall (2,000–4,000 mm), consistent heat above 24°C, and decades of government-supported expansion onto lowland peat and mineral soils.
Best U.S. states for major crop groups
USDA NASS Quick Stats tracks production, harvested area, and yield by state and county, making it straightforward to identify which states consistently lead each commodity. The Cropland Data Layer (CDL) maps this visually at high resolution for the continental U.S. The table below summarizes leading states by crop group, with the primary physical and economic reasons for their dominance. For deeper state-by-state rankings, a related article on this site covers the best U.S. states for growing crops. For detailed state-by-state rankings, see the article on the best state to grow crops (8f9e79a4-4cb0-40ea-adbd-455823798fa9).
| Crop / Crop Group | Leading States | Why They Lead |
|---|---|---|
| Corn (grain) | Iowa, Illinois, Nebraska, Minnesota, Indiana | Deep mollisol soils, 140–160 frost-free days, 28–36 inches annual precipitation, flat glaciated terrain, dense grain elevator infrastructure |
| Soybeans | Illinois, Iowa, Minnesota, Indiana, Ohio | Same Corn Belt soils and climate; crop rotation with corn; strong export market access via Mississippi River system |
| Winter Wheat | Kansas, Oklahoma, Texas (Panhandle), Washington (Palouse) | Cool dry winters, adequate spring moisture, well-drained silt loam soils; Palouse relies on deep volcanic loess soils |
| Spring Wheat | North Dakota, Montana, South Dakota | Short cool growing season suits hard red spring wheat; semi-arid climate reduces fungal disease pressure |
| Cotton | Texas, Georgia, Mississippi, Alabama, Arkansas | 210+ frost-free days, hot summers, low humidity at boll opening; Texas leads by area, though yield per acre is lower than Southeast |
| Fruits (temperate) | California (grapes, strawberries, almonds, citrus), Washington (apples, cherries), Oregon (pears, hazelnuts) | Mediterranean climate in California; mild Pacific-moderated climate in Pacific Northwest; irrigation infrastructure |
| Vegetables | California, Florida, Arizona, Georgia, Michigan | California's Central Valley has near-year-round production capacity; Florida's mild winters fill the off-season for the eastern U.S. |
| Specialty / Organic | California, Vermont, New York, Oregon, Colorado | Strong local and export markets; diverse microclimates; established supply chains for certified organic and specialty products |
Iowa and Illinois keep appearing at the top of grain rankings because they happen to sit over some of the most productive agricultural soils on earth, thick A-horizons of 12–24 inches of organic-rich topsoil laid down over millennia of prairie grassland. That depth of topsoil, combined with a reliable 30–34 inches of growing-season rainfall, makes them hard to beat for corn and soy even without irrigation. California's dominance in fruits, vegetables, nuts, and specialty crops is a different story: it is almost entirely built on irrigation water, a Mediterranean climate with virtually no summer rain, and the scale advantages that come from decades of concentrated production infrastructure.
Where crops were grown historically
Modern crop geography is inseparable from agricultural history. The crops that dominate a region today often trace back thousands of years to where they were first domesticated and then spread through trade, conquest, and colonization. Understanding these origins helps explain patterns that might otherwise seem arbitrary.
| Civilization / Region | Period | Staple Crops | Key Geographic Factor |
|---|---|---|---|
| Mesopotamia (Fertile Crescent) | ~10,000–3,000 BCE | Emmer wheat, einkorn, barley, lentils | Alluvial Tigris-Euphrates floodplain; early irrigation canals; Mediterranean climate with winter rains |
| Ancient Egypt | ~5,000–30 BCE | Emmer wheat, barley, flax | Annual Nile flood deposited fresh silt; near-zero rainfall meant total dependence on river irrigation |
| Indus Valley | ~3,300–1,300 BCE | Wheat, barley, cotton, sesame | Monsoon-fed Indus floodplain; alluvial soils; some of the earliest known cotton cultivation |
| Ancient China (Yellow River) | ~7,000–221 BCE | Foxtail millet, broomcorn millet (north); rice (Yangtze region) | Loess plateau soils in north; subtropical Yangtze basin for wet rice; distinct climate zones drove crop split |
| Mesoamerica (Maya, Aztec) | ~3,500 BCE–1521 CE | Maize (corn), beans, squash, chili peppers, cacao | Tropical highland and lowland climates; milpa intercropping system; volcanic soils in highland zones |
| Andean Civilizations (Inca) | ~3,000 BCE–1533 CE | Potato (hundreds of varieties), quinoa, maize (lower elevations), coca | High-altitude cool climate (3,000–4,500 m); terraced hillsides (andenes) created microclimates; freeze-dry food preservation |
| Roman Empire | ~500 BCE–476 CE | Wheat, barley, grapes, olives | Mediterranean climate across empire's core; North African grain provinces (Egypt, Carthage) fed Rome |
| Medieval Europe | ~500–1500 CE | Rye, oats, spelt, barley, peas, turnips | Cooler wetter climate than Mediterranean; heavy clay soils suited rye; open-field three-crop rotation system |
The Columbian Exchange (post-1492) reshuffled the global crop map more dramatically than any event before or since. Maize, potatoes, tomatoes, and chili peppers moved from the Americas to Europe, Africa, and Asia. Wheat, sugar cane, and coffee moved in the other direction. Many crops we now associate strongly with a region are actually recent arrivals: tomatoes are central to Italian cuisine but arrived in Europe only after 1521. Cassava is a staple in Sub-Saharan Africa but was domesticated in the Amazon Basin. These historical patterns matter practically because they tell us something about a crop's climate preferences and the types of soils it was originally adapted to.
A simple summary for younger readers
Farmers grow crops in fields, which can be on flat land or in valleys, near rivers, or on hillsides with terraces. They choose what to plant based on how warm and rainy their area is, what their soil is like, and what people nearby want to buy or eat. Rice grows in wet, warm places like Southeast Asia. Wheat grows in cooler, drier grasslands. Bananas grow only where it is warm all year. In the United States, farmers in the middle of the country (states like Iowa and Illinois) grow a lot of corn because the soil there is very deep and dark and there is plenty of rain in summer. Farmers in California grow fruits and vegetables because the weather there is mild and sunny almost all year long. Farmers have been growing crops for at least 10,000 years, starting in places like the Middle East, China, and Central America, and slowly spreading crops all around the world.
Practical decision guide: choosing crops for your site
Whether you are a beginning farmer, a serious gardener, or a student working on an agricultural project, the process for matching crops to a specific location follows a logical sequence. Rushing past the early steps is the most common mistake. Work through these checks in order before committing to a crop or spending money on seed or infrastructure.
Step 1: Climate assessment
Start with your climate zone and frost dates. Look up your USDA Plant Hardiness Zone and your average last spring frost and first fall frost dates using NOAA's Climate Normals (1991–2020 baseline) or the PRISM Climate Group tools from Oregon State University. Count your frost-free days. If you have fewer than 90, your options for warm-season crops narrow sharply. Check your average growing-season temperatures against the requirements of crops you are considering. The FAO EcoCrop database lists minimum, optimum, and maximum temperatures for hundreds of crops and is free to use.
Step 2: Soil assessment
Get a soil test before anything else. Your local university extension service typically offers analysis for $15–$30 and will return pH, major nutrient levels (nitrogen, phosphorus, potassium), organic matter percentage, and often texture class. For a quick location overview, pull up your property on USDA's Web Soil Survey (websoilsurvey.sc.egov.usda.gov), which uses SSURGO data to show soil series, drainage class, and agricultural interpretations at no cost. Most crops want pH 6.0–7.0. For practical guidance on target pH values and how to adjust soil acidity, see the article at which ph do most crops grow best. If your soil is outside that range, factor in the cost of liming (to raise pH) or sulfur amendments (to lower it) before committing to a crop.
Step 3: Water availability
Map your annual precipitation against crop water requirements. If you are in a region with less than 20 inches of annual rainfall, or where summer rainfall is unreliable, plan for irrigation from the start. Identify your water source (municipal, well, pond, stream), check your legal water rights if applicable, and estimate peak demand during mid-summer. GRACE satellite data has confirmed that aquifer depletion is already limiting long-term production in parts of the High Plains and Central Valley, if you are drawing from a stressed aquifer, factor that into your long-term crop plan and consider drip irrigation to reduce demand.
Step 4: Market and economic analysis
Physical suitability means nothing if there is no buyer. Research local and regional markets before selecting crops. Check USDA Agricultural Marketing Service data for local market prices. Visit your nearest farmers market and talk to vendors about what moves and at what price. For commodity crops, check the distance to the nearest elevator, processor, or co-op, transport costs for low-value-per-ton crops can quickly eliminate margins. For specialty or organic crops, assess whether your area has the consumer base or distribution network to support premium pricing.
Step 5: Labor and equipment
Some crops are mechanically harvested with minimal labor; others require intensive hand labor at precise times. Be honest about your labor capacity and budget. A half-acre of strawberries requires dramatically more hands-on time than a half-acre of winter squash. Assess whether your equipment (or equipment you can access or rent) matches the crops you are considering. Tillage, planting, and harvest equipment mismatches are a frequent reason small-scale farmers struggle with new crops.
Step 6: Scale and planning timeline
Start smaller than you think you need to. A test plot of 10–20 percent of your planned scale in the first year lets you identify pest, disease, and management challenges before they become expensive at full scale. Annual crops (corn, beans, vegetables) give you a one-season feedback loop. Perennial crops (fruit trees, asparagus, berries) lock you into a multi-year commitment before you see peak yields, factor that into your financial planning. Plan for at least three seasons of data before drawing conclusions about whether a crop works for your site.
Printable decision checklist
- Climate: Identify USDA hardiness zone, average frost-free days, and growing-season temperature range using NOAA Climate Normals or PRISM
- Soil: Run a soil test (pH, nutrients, organic matter, texture); cross-check with USDA Web Soil Survey for drainage class and soil series
- Water: Measure or estimate annual precipitation; identify irrigation source, water rights, and peak-demand feasibility
- Market: Research local crop prices, buyer locations, distance to processors or markets, and demand for your target crops
- Labor: Calculate realistic labor hours required for planting, maintenance, and harvest; compare to available labor supply
- Scale and planning: Start with a test plot (10–20% of planned area); set a minimum three-season evaluation period before scaling up
- Risk: Identify two or three major pest, disease, or weather risks for each candidate crop in your region and assess management options
- Crop shortlist: Narrow to two or three crops that pass all checks above, then compare seed costs, input costs, and projected margins
Tools and data sources worth bookmarking
These are the resources I find myself returning to most often when mapping crop distributions or helping someone think through where to grow something. They are all free and publicly accessible. MCD12Q1 MODIS/Terra+Aqua Land Cover Type Yearly L3 Global 500 m SIN Grid (NASA/LP DAAC) provides an annually updated global 500 m land-cover product that is widely used as a global cropland mask and baseline for mapping agricultural extent (DOI:10.5067/MODIS/MCD12Q1.006).
- FAOSTAT (fao.org/faostat): Country-level crop production, harvested area, and yield data going back decades — the gold standard for global crop statistics
- USDA NASS Quick Stats (nass.usda.gov): U.S. state and county crop data, customizable by commodity and year
- USDA Cropland Data Layer (NASS): Annual raster maps of crop distribution across the continental U.S. at high resolution
- USDA Web Soil Survey / SSURGO: Field-level U.S. soil maps with pH, drainage, and crop suitability interpretations
- FAO GAEZ v4 (gaez.fao.org): Global crop suitability and attainable yield maps combining climate, soils, and terrain
- FAO EcoCrop: Crop environmental requirements database — minimum, optimum, and maximum temperature and rainfall for hundreds of crops
- NOAA Climate Normals (ncei.noaa.gov): Official U.S. 1991–2020 climate baselines including frost dates and growing-season length
- PRISM Climate Group (prism.oregonstate.edu): High-resolution U.S. climate grids, frost date tools, and growing-season analysis
- SoilGrids (soilgrids.org / ISRIC): Global gridded soil pH, texture, and organic carbon maps at 250 m resolution
- WorldClim v2 (worldclim.org): Global high-resolution climate grids and bioclimatic variables used in crop suitability modeling
- University cooperative extension services: Your state's land-grant university extension office publishes locally-calibrated planting guides, soil test labs, and variety trial results — often the most practically useful resource of all
FAQ
Short answer: Where do farmers grow crops?
Farmers grow crops where climate, soils, water and markets align with each crop’s needs — typically in flat or gently sloped areas with suitable temperature and rainfall (or irrigation), fertile soils (right texture and pH), reliable water access and transport/market infrastructure. In practice this means tropical crops near the equator, cereals across temperate plains, and irrigated specialty crops in drier but well‑served valleys.
What physical and human factors determine where crops are grown?
Physical factors: climate (temperature ranges, growing‑season length, frost dates), precipitation and seasonality, soil properties (texture, drainage, organic matter, pH, depth), topography (slope, aspect, elevation), water availability (surface and groundwater), and pests/diseases tied to environment. Human factors: irrigation and infrastructure, market access and transport, land tenure and policy, labor and technology, input availability (seed, fertilizer), and cultural/culinary preferences.
How do climate and growing season control crop location?
Most crops need a minimum number of frost‑free days and specific temperature ranges during germination, growth and maturation. Tropical crops (bananas, cassava) require year‑round warmth and consistent rainfall; temperate cereals (wheat, barley) need cool seasons and defined winters; maize and soy prefer warm summers and moderate rainfall. Growing‑season length, last/first frost dates, and heat accumulation (growing degree days) are used to match crops to sites.
How do soils — including pH — affect which crops will succeed?
Soil texture controls water retention and root penetration; drainage affects root oxygenation; organic matter supplies nutrients and structure; pH influences nutrient availability (acidic soils limit phosphorus and molybdenum; alkaline soils limit iron, zinc). Some crops tolerate wide pH (barley), others need near‑neutral (alfalfa prefers pH 6.5–7.5) or acidic soils (blueberries prefer pH 4.5–5.5). Testing soil pH and nutrient status is essential before choosing crops.
Ranked examples: Best places in the world by major crop groups (with reasons)
- Cereals (wheat, maize, rice): North American Great Plains (wheat, maize) and U.S. Midwest (maize/soy) for deep fertile soils, mechanization and transport; Punjab‑Indo‑Gangetic Plain and North China Plain for wheat/rice thanks to fertile alluvial soils and irrigation; Nile Delta and Mekong for rice due to irrigation and seasonal floods. - Vegetables/fruit (high‑value): Mediterranean Basin and California Central Valley for long seasons, irrigation, proximity to markets and infrastructure; Southeastern Spain and Chile for year‑round export windows. - Tropical staples (cassava, plantain, oil palm): Amazon basin, Congo basin, West Africa, Southeast Asia (oil palm in Indonesia/Malaysia) where heat and rainfall are ample. - Cotton & fiber: Indian subcontinent, U.S. Southern Plains, parts of China for warm growing seasons, irrigated soils, and processing infrastructure. - Oilseeds (soy, canola): U.S. Midwest (soy), Canadian Prairies (canola) for suitable climates and mechanized large fields. Reasoning: combinations of climate suitability, soil fertility, water and infrastructure explain top areas.
Best U.S. states by major crop groups (ranked with reasons)
- Corn/soy: Iowa, Illinois, Nebraska — deep Mollisols, long warm summers, mechanization and storage/transport. - Wheat: Kansas, North Dakota, Montana — large plains, drier climate for spring wheat and winter wheat belts. - Rice: Arkansas, California, Louisiana — flat flooded fields, irrigation infrastructure. - Cotton: Texas, Georgia, Mississippi — warm season, irrigation where needed, ginning infrastructure. - Specialty fruit/vegetables: California (Central Valley/Santa Clara/Coastal) — Mediterranean climate, long season, markets and packing houses. - Tree nuts: California (almonds, pistachios) — Mediterranean climate, irrigation, processing capacity.
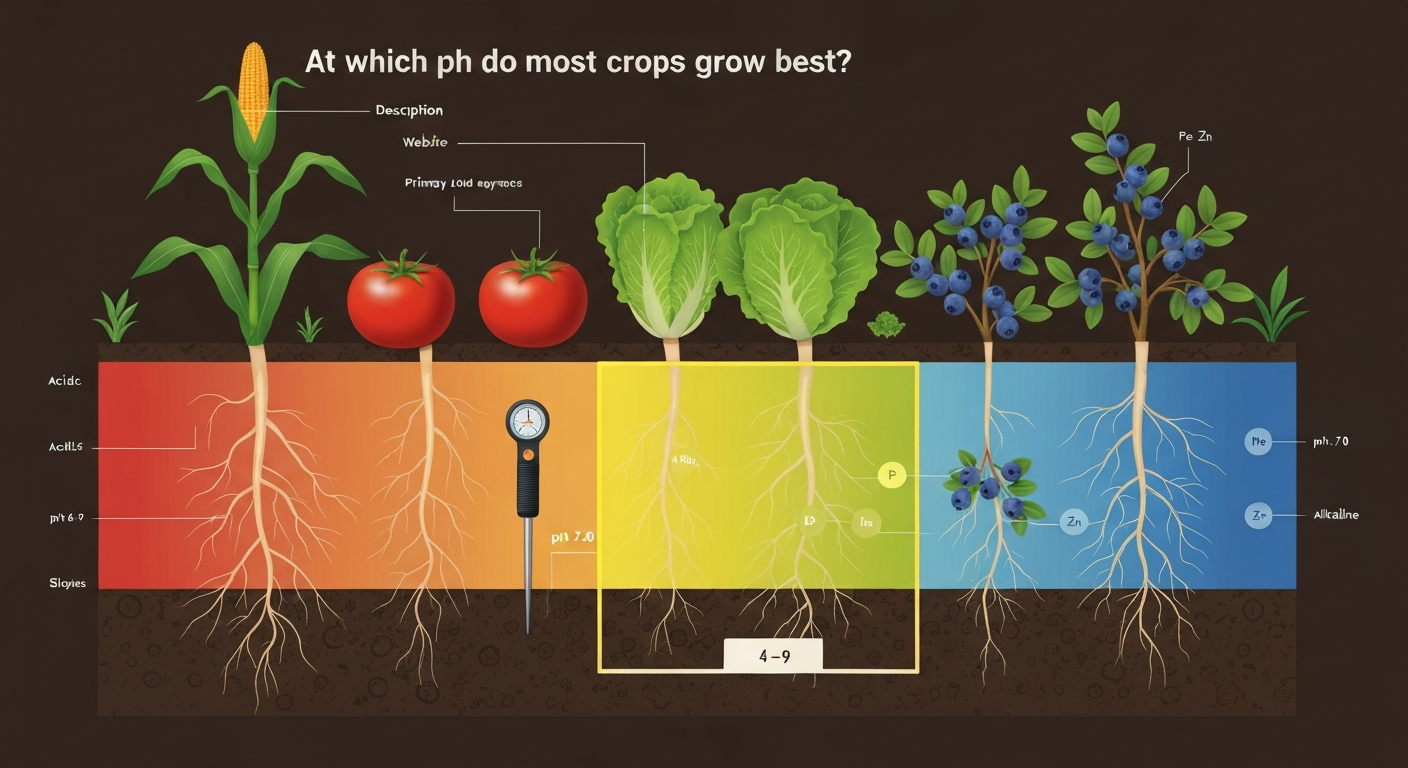
Find the optimum pH for most food crops, crop-by-crop ranges, testing and amendment steps, regional tips.
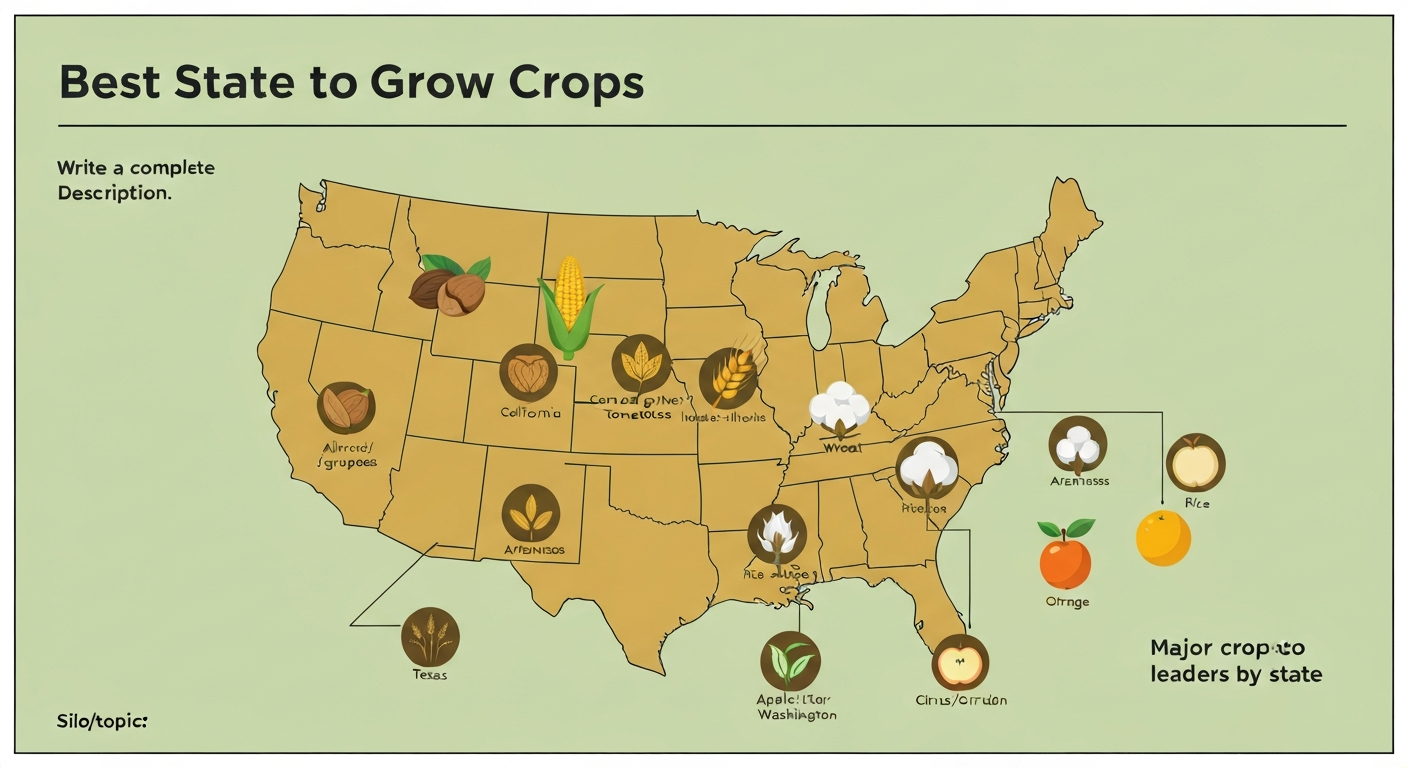
Discover which U.S. states are best for growing major crops, why they excel, and how to choose the right region.
A practical guide to the best crop regions by climate, water, soil and season length, with real examples and how to choo