Crops grow best where their specific needs for temperature, frost-free days, rainfall, soil type, and pH are consistently met. That sounds obvious, but the practical trick is matching those needs precisely to a real location. A corn field thrives in the Corn Belt because the soils are deep and fertile, summer heat units stack up reliably, and the frost-free window is long enough.
Where Do Crops Grow Best? Climate, Soil, Water by Crop

Samuel Rourke
14 Jun 2026
Rice dominates the Arkansas Delta because flat land, heavy clay soils, and irrigation infrastructure from the Mississippi Alluvial Aquifer make flooding practical. The answer always comes back to the same handful of drivers: climate (heat and season length), soil (pH, texture, drainage), and water (rainfall timing or irrigation access). Get those three right for your chosen crop, and you've found where it grows best.
How to tell what "best" means for your specific crop
"Best" isn't a single thing. It means different conditions for different crops, and it usually breaks down into four measurable factors: climate fit, soil match, water availability, and season length. Before you look at a map or a region, you need to know your crop's minimums and maximums in each of those categories. NRCS describes Web Soil Survey as the free public access system for the Nation’s soil resource data, enabling selection of mapped soils and their characteristics (including drainage and hydrologic properties) for crop placement decisions.
Climate: heat units and frost risk
Growing degree days (GDD) are the most reliable way to measure whether a location has enough heat for a crop to mature. GDD accumulates daily as the difference between your average daily temperature and a crop-specific base temperature. Corn uses a base of 50°F; wheat uses 32°F. Penn State Extension emphasizes that GDD predicts crop development far more accurately than counting calendar days, because a warm spring can compress the season while a cool one stretches it.
The USDA Climate Hubs layer in two other useful metrics: plant hardiness zones (minimum winter temperature survival) and heat zones (the number of days per year above 86°F). Together, these three give you a full thermal picture of any location. Frost-free period matters too. The NRCS defines it simply as the number of consecutive days when surface air temperature stays above 32°F.
If your crop needs 120 frost-free days and your location averages 95, that's your answer right there.
Soil: pH, texture, and drainage class
Most major field crops target a soil pH between 6. 0 and 7. 0. Corn and wheat both perform well in that range, with yield starting to decline noticeably below a critical pH of about 5.
5 for both. Potatoes are different: they prefer a more acidic 5. 3 to 6. 0, partly because that range suppresses common scab.
Blueberries are the outlier most people forget, with a target pH of around 4. 8. Soil texture and drainage class matter just as much. A crop like rice needs poorly drained, heavy clay soils because flooded paddies are part of the production system.
Most other crops need well-drained to moderately well-drained soils so roots can access oxygen. NRCS hydrologic groups give you a shorthand: Group A soils drain fast and are good for most upland crops; Group D soils have high water tables and suit only crops that tolerate wet conditions.
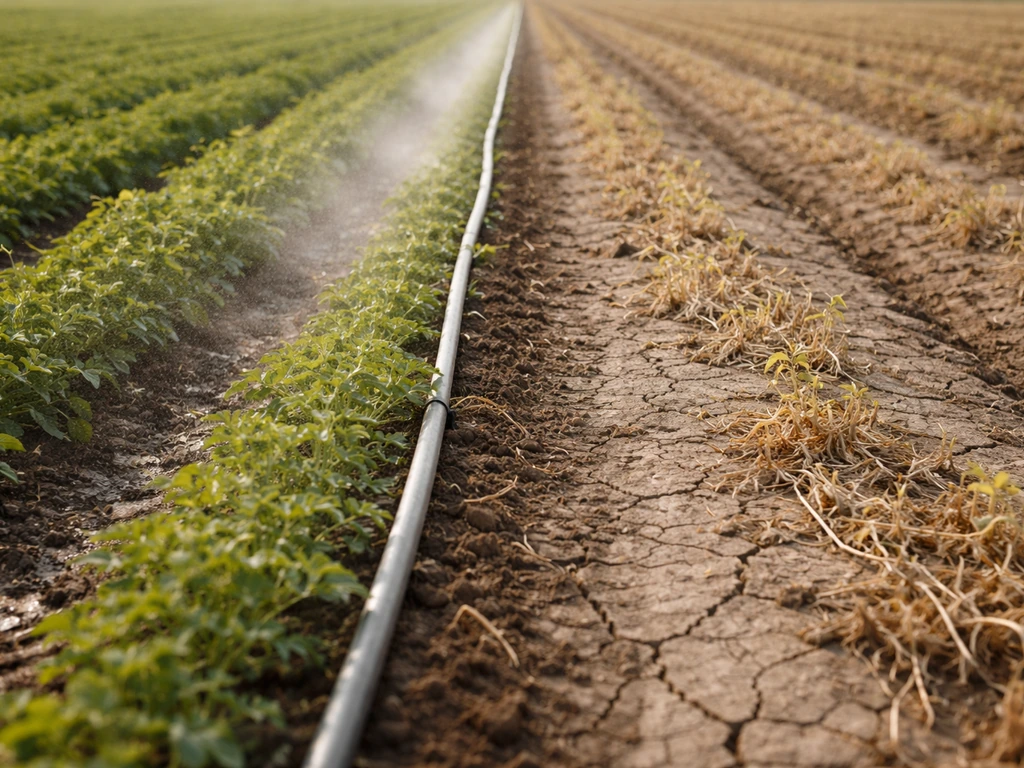
Water: rainfall timing and irrigation reality
FAO's evapotranspiration framework lays out how much water different crops actually consume during the growing season. Cotton is a heavy drinker, rice needs consistent flooding or near-saturation, and small grains like wheat and barley are comparatively modest in water demand. The key question isn't just total annual rainfall but when that rainfall arrives. Wheat and barley evolved in Mediterranean climates with winter rainfall, so they fit naturally into regions with wet winters and dry summers.
Cotton, rice, and corn need summer moisture, whether from summer-dominant rainfall or irrigation. Wherever natural rainfall doesn't align with a crop's peak demand period, irrigation fills the gap. But irrigation depends on reliable water sources, which is why groundwater depletion has already shifted regional crop patterns within the U. S.
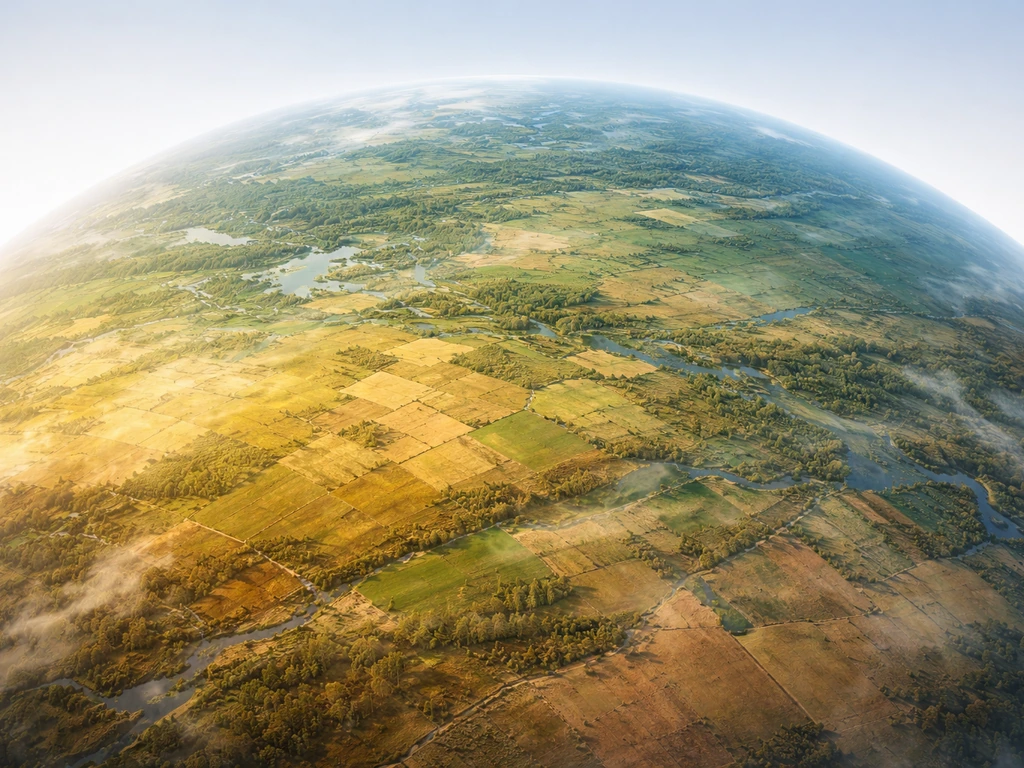
Global and U.S. crop zones: where major crops actually thrive
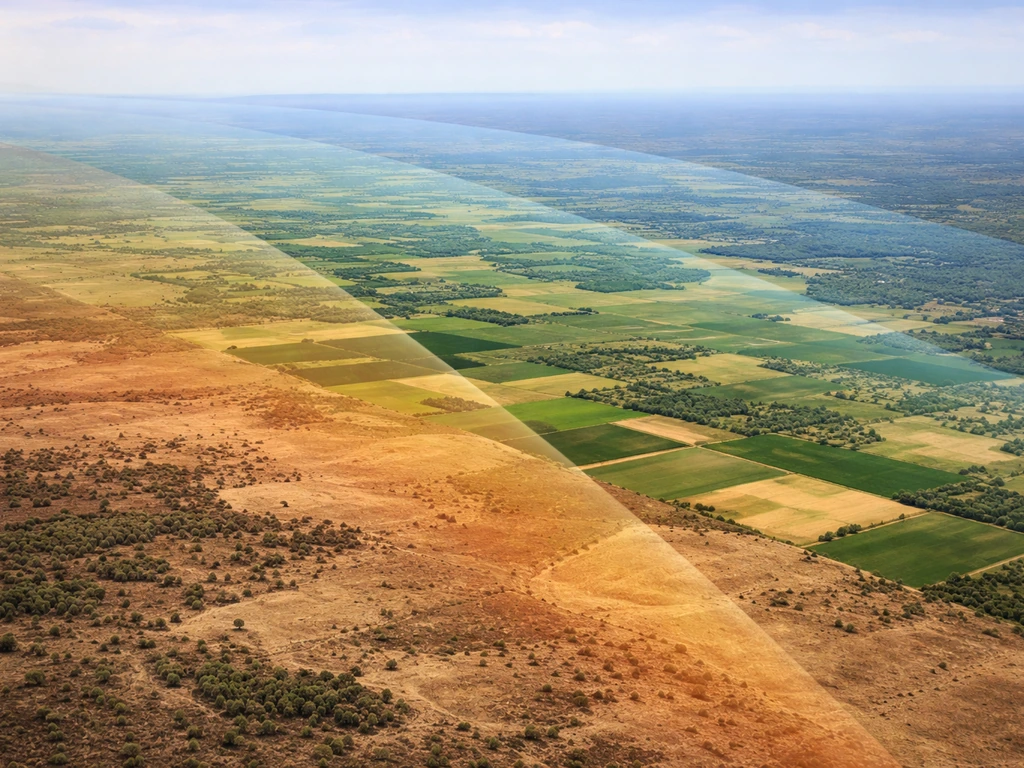
Climate drives the broad geography of crop production more than any other single factor. FAO's framework for crop zones groups regions by thermal regime and rainfall pattern, which is why you see consistent crop clustering across very different parts of the world that share the same climate type.
| Crop Category | Climate Type Needed | U.S. Example Region | Global Example Region |
|---|---|---|---|
| Winter wheat | Cool winters, dry summers, pH 6.0–7.0 | Kansas, Oklahoma, Texas Panhandle | Ukraine, northern India, northern China |
| Corn (maize) | Warm summers, 130+ frost-free days, pH 6.0–7.0 | Iowa, Illinois, Indiana (Corn Belt) | Brazil's Cerrado, eastern Europe |
| Rice (paddy) | Hot summers, flooding-tolerant soils, high water supply | Arkansas, Mississippi Delta, California Sacramento Valley | Southeast Asia, South Asia, West Africa |
| Cotton | Long, hot summers, 200+ frost-free days | Texas, Mississippi, Georgia | India, China, Egypt, Uzbekistan |
| Soybeans | Warm summers, moderate moisture, pH 6.0–7.0 | Illinois, Iowa, Minnesota | Brazil, Argentina |
| Potatoes | Cool growing season, well-drained soil, pH 5.3–6.0 | Idaho, Maine, Wisconsin | Russia, Peru, Germany |
| Blueberries | Mild climate, acidic sandy soils, pH 4.5–5.0 | Michigan, New Jersey, Oregon | Canada, Chile, Poland |
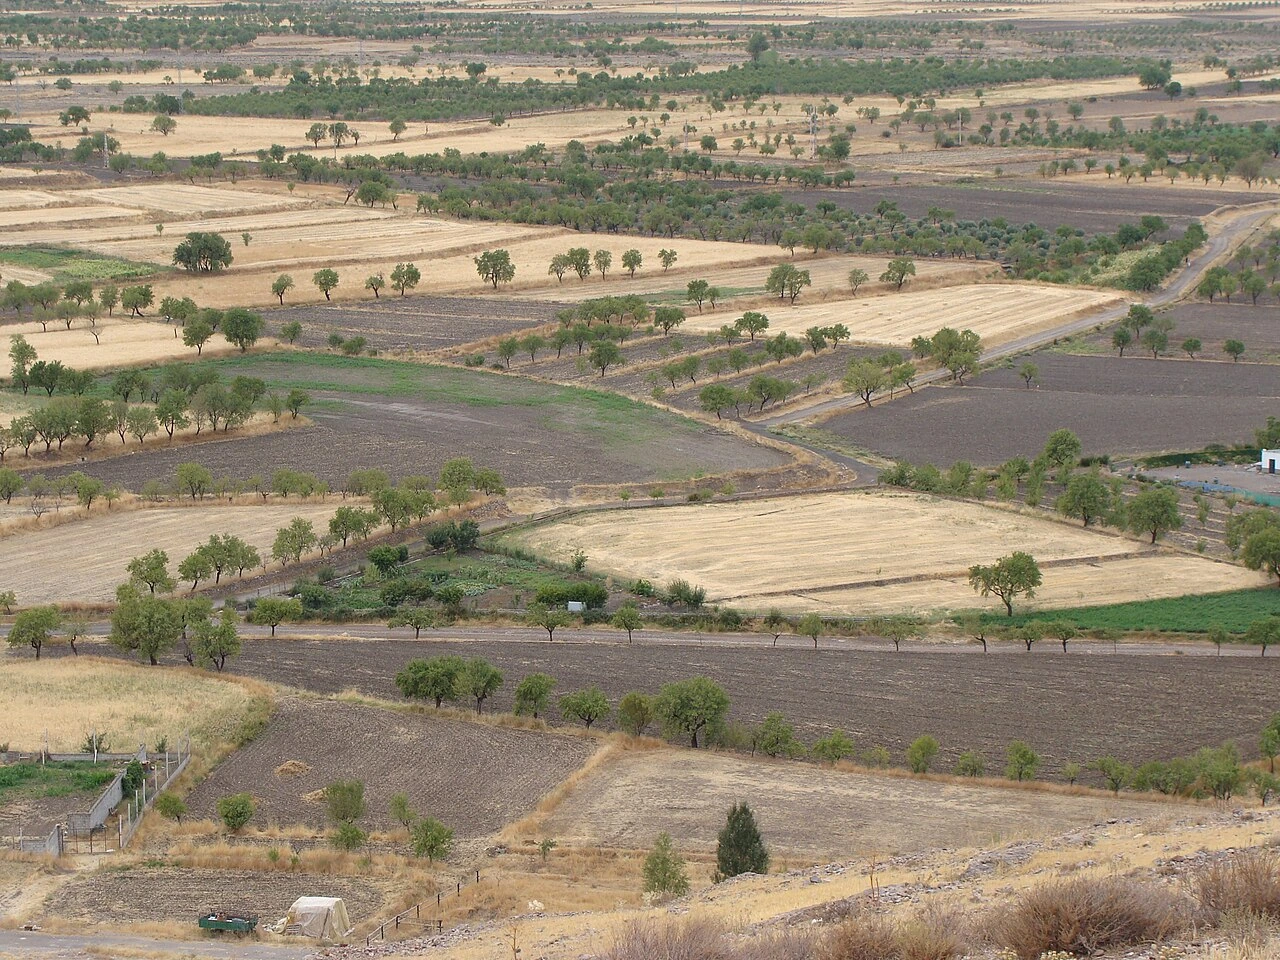
Arkansas is the clearest U.S. example of how climate, soil, and infrastructure combine to define a crop's best region. The state leads national rice production, with over 1.43 million acres harvested in 2024 alone. That's not a coincidence. The Mississippi Delta's flat topography, heavy clay soils, warm summers, and access to aquifer irrigation make Arkansas naturally suited for paddy rice in a way that most U.S. states simply aren't. If you want to understand why the best places to grow crops look the way they do, Arkansas rice is a textbook case worth studying.
Soil and terrain: the pH, texture, and drainage match
Soil is the layer most people get wrong when they're trying to figure out where a crop will grow best. They focus on climate and ignore what's underfoot. The two have to align. A location with perfect temperature and rainfall for corn still won't produce a great crop if the soil is shallow, compacted, or has a pH of 5.0 without lime amendment.
pH requirements by crop type
Most vegetable crops, grains, and legumes perform best in the 6.0 to 7.0 range because nutrient availability peaks there. Below 5.5, aluminum and manganese can reach toxic levels in many soils, and phosphorus becomes less available. That's why the critical pH threshold for corn and wheat sits around 5.5: yields drop measurably below that point even if every other factor is right. Crops like potatoes and blueberries are genuine exceptions, not just because they tolerate acidity but because they actually need it to compete with disease pressure and access iron and other micronutrients.
Texture, drainage class, and rooting depth
Soil texture (the ratio of sand, silt, and clay) determines water-holding capacity and drainage speed. Sandy soils drain fast but dry out quickly, which suits drought-adapted crops in areas with consistent rainfall. Clay soils hold water but restrict root oxygen, which is ideal for flooded rice but a serious problem for corn, wheat, or potatoes. Loamy soils strike the balance that most crops prefer.
Beyond texture, drainage class matters at the field scale. USFS research confirms that depth to the water table and available soil water volume for roots are primary drivers of soil productivity. A soil that looks fertile on paper but sits above a seasonal high water table at 18 inches is poorly suited to deep-rooted crops regardless of its nutrient profile.
Water and temperature realities: rainfall vs. irrigation and heat limits
Temperature and water are the two variables that most directly limit where crops can grow without expensive intervention. That practical framework is why some places become top growing regions while others cannot support the same crops without intervention where crops can grow. Understanding both for your specific crop is essential before committing land or resources to production.
Heat limits and frost windows
Every crop has a minimum temperature below which growth stops and a maximum above which heat stress kicks in. Corn's GDD base of 50°F means it stops accumulating productive heat once temperatures drop below that point. Late spring frosts are a particular concern because the risk changes as the plant develops. [SDSU Extension points out that corn's growing point stays below the soil surface until about the V6 stage](https://www.
sdstate. edu/late-spring-frost-damage-corn-and-soybeans), so early-season frost can kill the visible leaf tissue while the plant survives and recovers. After V6, the growing point is above ground and a hard freeze can be fatal. University of Minnesota Extension uses GDD modeling to flag that planting corn before mid-April in Minnesota increases the risk of plants reaching the vulnerable V1 stage before the last spring freeze.
These aren't abstract numbers: they're the practical limits that define whether a location is genuinely suited to a crop or just borderline.
Rainfall timing vs. irrigation dependence
Where natural rainfall doesn't match a crop's peak demand window, irrigation is the fix. But irrigation is only as reliable as its water source. USDA ERS data shows that the Southern Plains' irrigated acreage declined sharply starting in the 1980s because the Ogallala Aquifer was being drawn down faster than it recharges. Meanwhile, irrigation expanded in the Mississippi Delta and Southeast, partly because aquifer supplies there are more stable and producers could respond more flexibly to dry growing seasons.
California's rice acreage dropped significantly in 2014 and 2015 when persistent drought made water allocations uncertain, forcing a shift toward less water-intensive crops like almonds. The lesson is that irrigation doesn't permanently fix a climate mismatch. It depends on sustained, affordable water access, and that can change.
Salinity: the underappreciated water quality factor
FAO's salt tolerance framework is worth knowing if you're farming in arid or semi-arid regions, or anywhere irrigation water comes from marginal sources. Salinity is measured in electrical conductivity (EC), and every crop has a threshold above which yield declines. If soil salinity builds up from irrigating with saline water, you need to leach salts below the root zone before concentrations exceed the crop's tolerance. FAO is explicit: good crop production requires maintaining high soil water availability and flushing accumulated salts before they reach damage thresholds. This is why drainage infrastructure matters even in irrigated systems.
Historical patterns: why the best regions shifted over time
The geography of crop production has never been fixed. What looks like a "natural" match between a crop and a region is often the result of centuries of human management, varietal selection, and infrastructure investment. Understanding that history helps explain current crop maps and warns against assuming today's patterns are permanent.
Ancient wheat and barley cultivation spread through the Fertile Crescent and Mediterranean basin because winter rainfall patterns and mild temperatures matched those crops' growth cycles almost perfectly. That wasn't luck: early farmers selected those crops because they worked in the environment they had. Settlers in the Americas found crops domesticated by Indigenous peoples already matched to local climates: corn in the warm, moist Eastern Woodlands and Great Plains, potatoes in the cool Andean highlands, cotton in the hot lowlands. As settlers moved across North America, they brought crops with them and often discovered the hard way that their familiar varieties didn't work outside their home climate zone.
Human management has repeatedly extended or shifted where crops can grow. Irrigation opened the San Joaquin Valley to intensive rice, cotton, and vegetable production in climates that would otherwise be too dry. Lime applications corrected acidic Appalachian soils enough to support crops that would have failed without amendment. Breeding programs created short-season corn varieties that pushed productive corn production further north into Minnesota and the Dakotas than 19th-century farmers could have managed.
Climate itself has also shifted which regions are most productive. USDA Climate Hubs documents measurable shifts in growing degree day accumulation and plant hardiness zone boundaries, meaning that some northern U. S. regions now accumulate GDD totals that were historically only seen further south.
That doesn't automatically make them better for all crops, but it does change the calculus for certain long-season varieties.
How to find the best location for your crop right now
If you're trying to pin down where a specific crop will grow best, whether for your own land or a region you're researching, here's a practical sequence that works whether you're a gardener with a half-acre or a farmer scouting new ground.
- Start with GDD and frost-free days for your crop. Look up the GDD requirement for the variety you're considering, then check whether your location typically accumulates that total between last spring frost and first fall frost. USGS maintains a gridded climate database for the continental U.S. with historical GDD data based on 30-year means, making regional comparisons straightforward.
- Check hardiness and heat zones. USDA Plant Hardiness Zone maps and USDA Climate Hub heat zone data give you the cold-minimum and hot-maximum picture for any U.S. location. Perennial crops especially depend on winter hardiness, but even annual crops can fail if summer heat zone mismatch creates heat stress during pollination.
- Run a soil check using Web Soil Survey. NRCS's Web Soil Survey is free and gives you mapped soil types for any U.S. parcel, including drainage class, hydrologic group, and soil pH data. Use it to confirm whether the soil at your target location is even in the right ballpark for your crop before investing in amendments.
- Do a physical drainage test on site. WSU Extension recommends a DIY percolation test as the simplest way to verify what the map shows. Dig a hole about 12 inches deep, fill it with water, let it drain, fill again, and time how fast it empties. Faster than 1 inch per hour suggests good drainage; slower than 0.5 inches per hour in the second fill signals potential waterlogging problems.
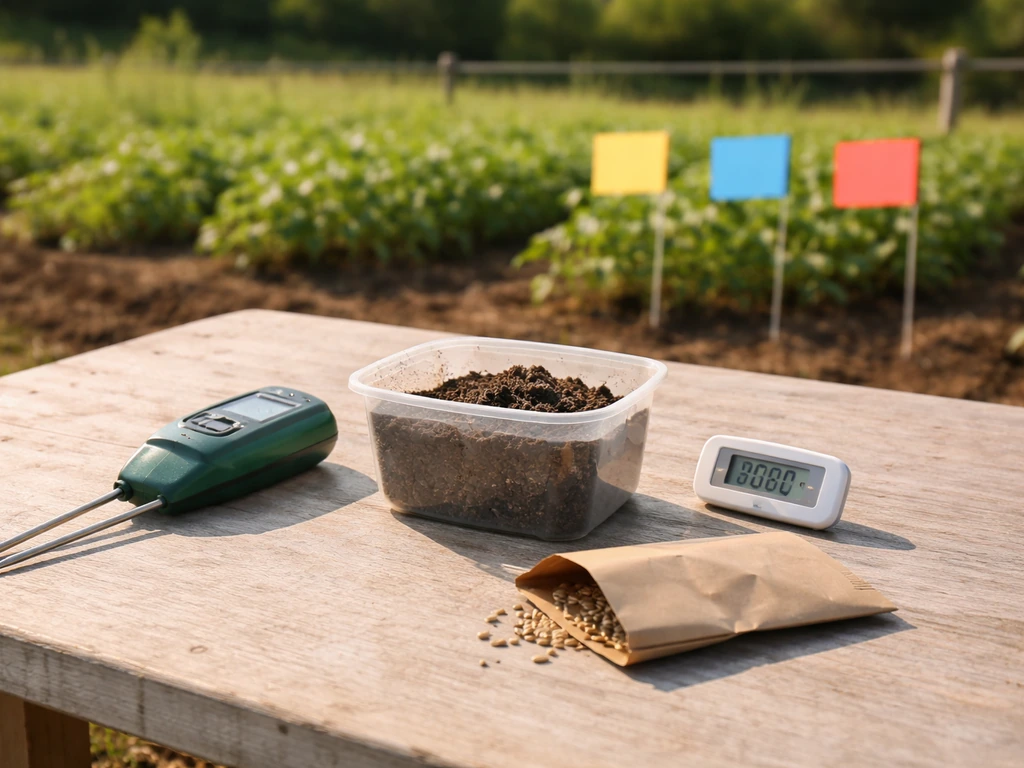
- Get a soil test for pH and nutrients. Your local cooperative extension office can direct you to a certified soil testing lab. A basic test costs around $15 to $30 and gives you actual pH, phosphorus, potassium, and organic matter numbers for your specific soil. This is non-negotiable if you're making planting decisions: mapped soil data gives averages across a soil type, but your field may vary.
- Contact your local extension office. Every U.S. state has a cooperative extension service with crop-specific planting guides, variety trials, and local GDD tracking data. They know which varieties perform best in your county's specific conditions, and that local knowledge is worth more than any general guide. Extension agents are also aware of regional soil and water quality issues that wouldn't show up in national databases.
- Consult crop-specific planting guides and variety trial data. University extension services publish annual results from local variety trials showing which specific varieties performed best in your climate. This is where GDD-based heat unit information becomes most actionable: you can match a variety's GDD requirement to your location's typical accumulation and choose accordingly.
Quick reference: what to check and where to find it
| Factor to Check | Tool or Resource | What to Look For |
|---|---|---|
| GDD accumulation | USGS gridded climate database, state extension GDD tools | Does your location hit the crop's required GDD total in a typical season? |
| Frost-free period | NRCS Climate Glossary, state climate offices | Is the frost-free window long enough for your crop variety? |
| Hardiness and heat zones | USDA Plant Hardiness Zone Map, USDA Climate Hubs heat zone data | Does winter minimum fit the crop? Are summer heat days within tolerance? |
| Soil type and drainage | NRCS Web Soil Survey (free, map-based) | Drainage class, hydrologic group, mapped pH, texture class |
| On-site drainage | DIY percolation test (bucket and timer) | Drainage speed: >1 inch/hour = good; <0.5 inch/hour = problem |
| Actual soil pH and nutrients | Certified lab soil test via extension office | Target pH for your crop; phosphorus, potassium, organic matter levels |
| Local variety performance | State extension variety trial reports | Which varieties produced best in your county's specific climate |
The clearest path from question to answer is: know your crop's numbers (GDD, pH, drainage need, frost-free days), then check whether your location and soil actually deliver those numbers, and fill the gaps with local extension expertise and variety trial data. That sequence works whether you're matching a crop to a U. S. state, a specific county, or a single field.
The site's coverage of specific crops by region, state, and historical period can help you build that picture quickly, whether you're trying to understand why certain states dominate production or tracing how cultivation zones have shifted over centuries. For a broad view of the best place to grow crops in the world, start by comparing these climate, soil, and water fit factors across major crop zones.
FAQ
If two regions have similar temperature and rainfall, how can I tell which one will actually be better for my crop?
Start by verifying frost-free days and heat accumulation with GDD for the exact planting window you plan. Then confirm soil pH and drainage class, because two areas with the same climate can perform very differently if one has a shallow water table or compaction limiting root depth.
Can I rely on climate maps alone if I want to know where crops grow best?
Use soil and water testing for the whole field or garden area, not just one spot. EC or salinity can vary by irrigation line and low spots, and pH can shift with past liming, fertilizer use, and drainage, which changes crop fit even when the macro-climate looks ideal.
What’s the most common mistake when evaluating “best” growing areas for temperature-limited crops?
Borderline suitability usually fails because of timing, not averages. For example, a location might meet average heat totals, but late spring cold snaps can harm early growth stages, so check frost dates relative to your crop’s vulnerable stages and planting depth.
If my location seems too dry, does irrigation automatically make it a top place to grow crops?
Yes, because irrigation success depends on reliability and on removing salts when water quality is marginal. Before assuming irrigation solves a mismatch, plan for drainage and leaching capacity, and budget for possible yield penalties if salinity or water restrictions change over time.
How do I evaluate drainage when I’m deciding where crops can grow best on a specific farm?
Match the crop to the field’s drainage and water-table behavior, then choose the variety within that constraint. Deep-rooted crops generally need more consistent oxygen access, while crops tolerant of wet feet (like rice) align with poor drainage and field-scale flooding.
Should I use hardiness zones, heat zones, or frost-free days when deciding crop suitability?
Plant hardiness zones and heat zones are useful shortcuts, but they do not replace frost-free period and GDD. A crop can survive winters yet still fail to mature if heat accumulation is too low for your maturity duration.
Why might a crop variety do well in one county but fail in the neighboring one even if climate seems similar?
Even within the same crop, variety maturity length and base temperature assumptions can differ. Use variety-specific GDD requirements from credible local trials, then compare them to location GDD for your planting date to avoid accidentally choosing a “right climate” variety that still matures too late.
What should I consider before liming, if soil pH is the main reason a site might not be ideal?
If your pH is below the crop’s sweet spot, you often need both liming and a plan for how long it takes to change pH in your specific soil. Also account for micronutrient shifts, because bringing pH up can change iron availability and disease pressure, affecting performance beyond yield.
How can salinity affect where crops grow best in irrigated regions?
Yes, salt risk can be high even in places with moderate rainfall if irrigation brings in saline water or if evaporation concentrates salts. Check EC trends over time and ensure the system includes drainage and leaching capability, not just more water.
If rainfall timing does not match crop demand, what practical options do I have besides changing regions?
You can adapt the crop choice, management, or both. If climate and water are fixed, rotate or select crop types whose peak demand aligns with your rainfall pattern, then use irrigation only for the growth stages that are actually limiting.
Next Articles
Where Do Crops Grow? Climate, Soil, and Water Rules
Learn where crops grow by climate, soil, and water, with U.S. examples and steps to map matches for any location.
What Did the Delaware Colony Grow: Crops, Uses & Legacy
Colonial Delaware’s main crops, grains, hay, flax, fruits, vegetables, livestock, why they thrived and how they were sold.
What Did Jamestown Grow and How They Farmed It
Learn what Jamestown colonists grew and the methods they used to plant, harvest, and adapt crops to Virginia conditions.